On May 28, 2020, Google introduced some important metrics called “Core Web Vitals” that determine the performance of a webpage. In mid-June 2021, Core Web Vitals became one of the essential factors for ranking a page on Google.
What are Core Web Vitals?
Core Web Vitals are a set of metrics that are used to evaluate a website’s user experience. These metrics capture the quality of the user experience of any website.
The user experience of a website is as important as its content, SEO, and design. If users are not having a good experience on your site, then the long-term success of the website can potentially be negatively affected.
Core Web Vitals includes three metrics:
- Largest Contentful Paint. (LCP)
- First Input Delay. (FID)
- Cumulative Layout Shift. (CLS)
These three metrics aim to measure a website’s page loading, visual stability, and interactivity. Let’s see why they are important from an SEO perspective.
Why are Core Web Vitals Important?
According to Google, a good user experience allows individuals to engage more deeply and spend more time on the website; on the other hand, a terrible page experience may prevent the user from revisiting the website.
By incorporating page experience signals among the hundreds of factors considered by Google when ranking a website in SERPs, they want to make it easier for visitors to find websites that are easy to interact with and provide an enjoyable user experience.
Core Web Vitals are officially one of the ranking factors announced by Google. If your website does not perform well on these metrics then you may experience ranking drops in your keywords.
Analyzing User Experience with Core Web Vitals
Now that you have a general idea of Core Web Vitals-let’s delve deeper into the intricacies. There are three significant factors to consider in Core Web Vitals that site owners or developers can use to measure the quality of user experience. These factors are loading speed, visual stability, and interactivity.
So, let’s take a look at these factors and aspects recommended to enhance your Core Web Vitals:
1. Largest Contentful Paint (LCP) or Page Loading.
LCP measures the render time of the largest image or text block visible within the viewport, relative to when the page first starts loading.
To further our understanding of LCP, we need to be clear about what viewport and render time is. Simply put, a viewport is the user’s visible area of a webpage. A user might check the webpage on different devices with different sizes, so the viewport (which is the visible area of the webpage) might differ on each device.
Coming to the render time, it is the time a webpage takes to be visible on the user’s device.
So LCP metric uses the largest element within the viewport and reports the time it takes that element to render on the screen. That’s indicative of the loading performance of the whole webpage.
It is possible that the largest element is different on different devices which means you can have different LCP scores on different devices.
Now, what are the largest elements that are taken into account while calculating LCP? These are:
- Image elements. These are wrapped in <img> tag.
- <image> elements inside an <svg> tag.
- Motion posters.
- Featured images or background images (Load via url() function)
- Blocks of texts. These are wrapped in <p> tags.
What is the Ideal score for LCP?
A URL with an LCP of 2.5 seconds or less is considered “excellent” by Google. A time between 2.5 and four seconds has to be improved. A time of more than four seconds is deemed unsatisfactory.
2. First Input Delay (FID) or Interactivity
FID helps us quantity the interactivity of a webpage.
To fully grasp what FID is, we need to understand a few key terms.
Interaction on a webpage means a click on a button, tap on a link, or some other kind of click such as calling, filling a form, etc.
When such interaction happens on a webpage then it is referred to as an event and the way the webpage responds to such events is referred to as event handling.
FID measures the time from when a user interacts with a page to the time when the browser is able to begin event handling. This time is indicative of the interactivity of a webpage, i.e; how fast a webpage is able to handle interactions from the users.
FID becomes important in the context that today’s users prefer websites that are quick to load and easy to interact with. A webpage that is laggy can frustrate the user leading him to abandon the website.
The website abandonment causes high bounce rates which may affect your SEO performance and conversions.
To boost engagement and usability throughout the site, developers must minimize users’ time waiting for a browser to respond to their queries.
The developer’s objective should be to attain 100 milliseconds or less response time.
3. Cumulative Layout Shift (CLS) or Visual Stability
Imagine you are about to click a button on a webpage and suddenly the button changes its position and you end up clicking something else!
This is what we call a layout shift. A layout shift happens when the elements on a webpage change their position unexpectedly. CLS measures those layout shifts. Calculating CLS helps us gauge the stability of a webpage.
User experience and interface are vital in keeping users glued to the website. If a web page switches elements or a pop-up pops out of nowhere on the screen while a user is reading, the user will grow annoyed.
The pages must score fewer than 0.1 seconds to qualify for the CLS metrics.
How to improve Core Web Vitals?
If you run page speed insights on your webpage, it will show you opportunities where you can optimize your core web vitals. Nevertheless, here are some opportunities which are applicable to almost all web pages.
Ways to Improve your LCP Score
Some significant ways to improve LCP score are:
- Optimize slow servers.
- Improve the CSS and javascript.
- Move to a faster web host.
- Optimize large blocks of content, etc.
Ways to Improve your CLS Score
- Stop ads that cause changes in the layout.
- Add images with dimensions.
- Add iframe (HTML doc inside another HTML doc) and embed with dimensions.
- Avoid using FOIT and FOUT font loading strategies.
- Stop pop-ups that cause a shift in the layout, etc.
Ways to Improve your FID Score
- Avoid long tasks.
- Optimize large javascript bundles.
- Implement browser caching.
- Avoid render-blocking javascript
- Remove unused CSS.
- Inline critical CSS and javascript.
Statistics
Some general Core Web Vital Stats
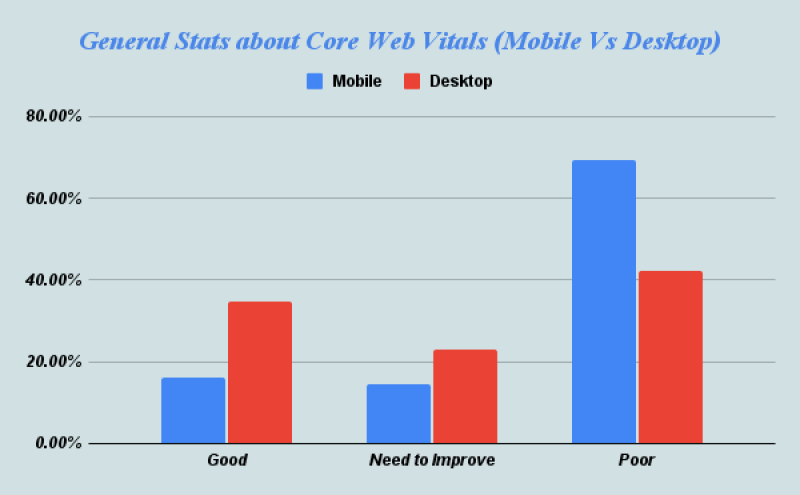
According to a study conducted by Semrush, here are some of the essential stats about Core Web Vital:
- Almost 84% of Core Web Vitals for URLs ranked in the top 10 on mobile SERPs in the United States were rated as “Poor” or “To Improve.”
- The overall percentage of URLs with all metrics falling in the “Good” category for mobile is 16.2% and 34.7% for desktop.
- The overall percentage of URLs with at least one metric falling in the “Need to Improve” category and the rest in the “Good” category for mobile is 16.2% and 34.7% for desktop.
- For mobile, the overall percentage of URLs with at least one “Poor” indicator is 69.3 %, whereas, for desktop, the share is 42.4 %.
- For mobile, the overall percentage of URLs with all metrics in the “Poor” category is 7.8 %, whereas, for desktop, the share is 1.3%.
- The most optimized URLs (based on the percentage of URLs with all “good” metrics) are ranked second for both mobile and desktop.

Some Interesting stats about LCP
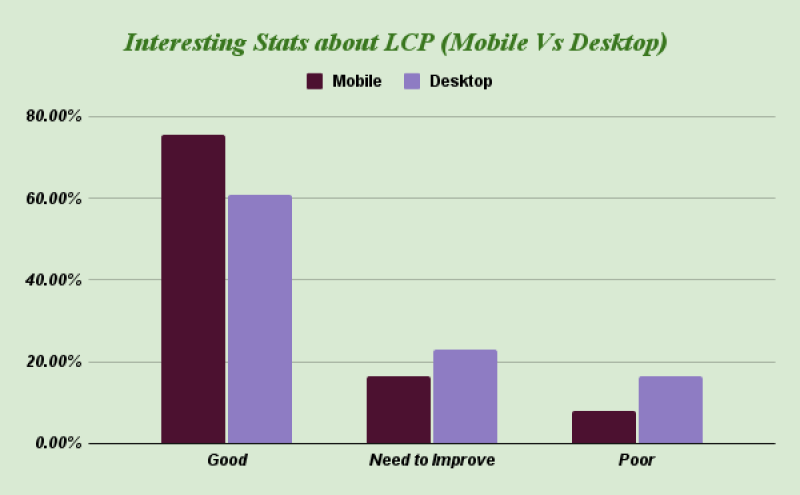
- 60.8% of desktop pages have an excellent LCP score, while 23% need to improve, and 16.3% of websites are deemed considerably poor. (Semrush)
- According to the report by web.dev, developers should aim for LCP of less than 2.5 seconds, as just 43% of mobile URLs and 44% of desktop URLs pass this benchmark.
- The average B2B site has an LCP score of 7.05 seconds, while the average retail site has an LCP of 9.17 seconds, which is much beyond the 2.5s level. (Brightedge)
- 75.6% of mobile pages have an excellent LCP score, while 16.3% require notable work, and 8% of websites are deemed considerably poor. (Semrush)

Some Interesting stats about CLS
- Out of 78,867 URLs analyzed, 59% of desktop pages had an excellent CLS score, while 26% needed to improve, and 14.9% of websites were deemed considerably poor. (Semrush)
- Developers should aim for CLS in less than 0.05 seconds, as nearly 50% of mobile URLs and 42% of desktop URLs pass this benchmark. (Web.dev)
- Out of 78,434 URLs analyzed, 59.6% of mobile pages had an excellent CLS score, while 17.8% required notable work, and 22.5% of websites were deemed considerably poor. (Semrush)
- The average B2B site has a CLS score of .09 seconds, while the average retail site has a CLS of .15 seconds. (Brightedge)

Some Interesting stats about FID
- Out of 78,867 URLs analyzed, 74.9% of desktop pages had an excellent FID score, while 13.8% needed to improve, and 11.4% of websites were deemed considerably poor. (Semrush)
- Developers should aim for FID of less than 100 milliseconds, as nearly 78% of mobile URLs and less than 99% of desktop URLs pass this benchmark. (Web.dev)
- The average B2B site has a CLS score of 57.01 ms, while the average retail site has a CLS of 78 ms. (Brightedge)
- Out of 78,434 URLs analyzed, 25.4% of mobile pages had an excellent CLS score, while 13.8% required notable work, and 60.8% of websites were deemed considerably poor. (Semrush)

Tools to measure Core Web Vitals
Some of the essential tools to measure core web vitals are:
- Search Console: Used to analyze site traffic, keywords performance, resolve errors, indexing of URLs, access core web vitals, and much more
- PageSpeed Insights: It can assist you in identifying important technical issues on your site that may be affecting its speed and performance.
- Lighthouse: Automated free tool provided by Google to run technical website audits (performance, accessibility, and SEO).
- Web.dev: The objective of web.dev is to assist developers in creating best-in-class web experiences on any browser.
- Chrome UX Report (CRUX): Dataset containing real-world user experience data from millions of websites available publicly.
- GT Metrix: Used to measure the speed and performance of a website and it relies on Google Lighthouse.
- CLS Debugger: This allows for the examination of layout shift that occurs on both the mobile and desktop versions of a website.
- Semrush: Used to analyze site traffic, keywords, and backlinks performance, find errors, access core web vitals, and much more. This tool depends on Google Lighthouse for data to analyze core web vitals.
- Chrome Dev Tools: In-built Google chrome tool used for debugging and web authoring.
- Web Vital Extension: Useful Google chrome extension to assess core web vitals on desktop.
Other Vital Metrics
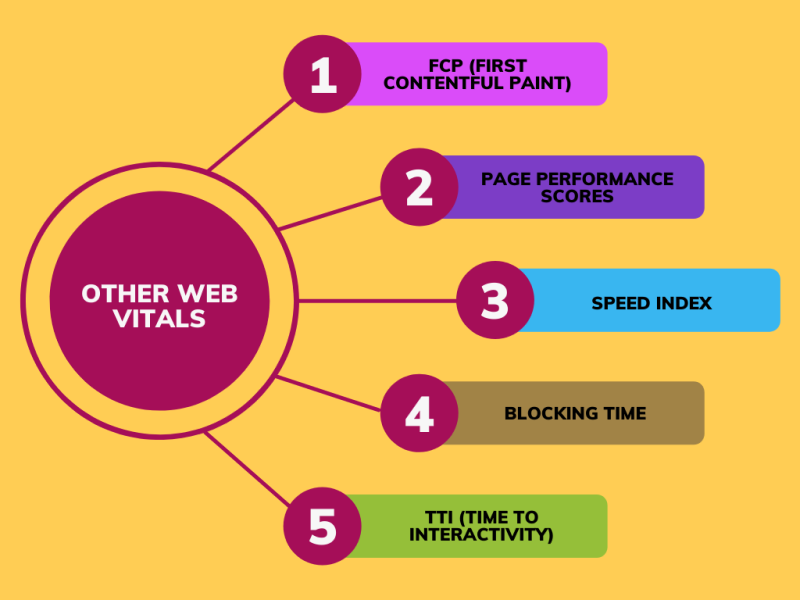
Apart from the Core Web Vitals, other metrics are not considered an essential part of the user experience. Still, these metrics assess lag times and other technological variables that might negatively influence how users interact with a web page. So, let’s take a brief look at a few different metrics you may use to understand how visitors interact with your site.

1. First Contentful Paint (FCP)
First Contentful Paint (FCP) is a performance metric that calculates how quickly visitors can view your page’s actual DOM (Document Object Model) elements (i.e., text, images, video, etc.).
2. Page Performance Scores
A Page Performance Score is a measure that assesses all of the vital user experience indicators in Core Web Vitals. This score is based on an average of all mobile and desktop engagements. The average offers a single score to rapidly check on pages that require closer inspection.
3. Speed Index
Speed Index (SI) page load performance metric measures the average time it takes for information on your website to be shown to a user. Swift websites provide better online experiences, thus increasing engagement and conversions.
4. Blocking Time
It is a lighthouse metric that calculates the total length of time between the first contentful paint (FCP) and the time to interactive (TTI) when the main thread was stalled for a long enough period to prohibit input responsiveness.
5. Time To Interactivity (TTI)
Time to Interactive (TTI) is a non-standardized lighthouse ‘progress’ indicator that measures how long it takes for a page’s content to become functional and fully interactive.
Conclusion
Core Web Vitals are vital are necessary for SEO and web analytics since they assist your website get visibility on SERPs and increasing conversions while keeping it organized and uncluttered. These essentials can boost your website’s engagements and provide a hassle-free surfing experience for your audience. It is preferable to begin optimizing your website as soon as possible to deter receiving negative reviews.
Featured Image: Photo by Joanna Kosinska on Unsplash
